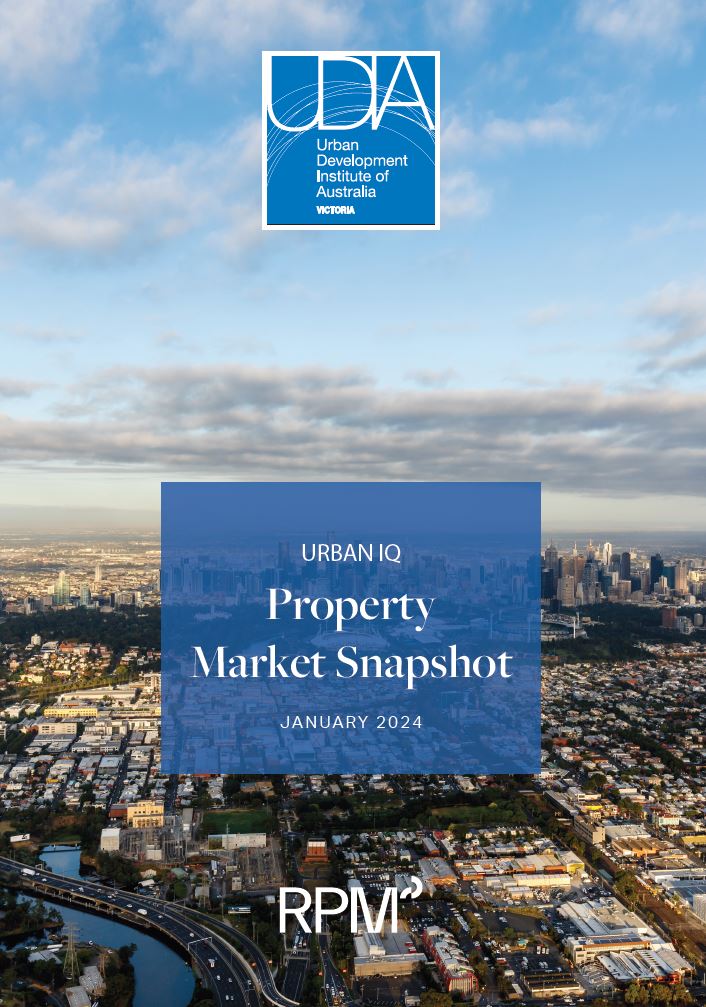
UDIA Victoria, in partnership with RPM Group, has released the latest quarterly URBAN IQ research publication.
The research provides data, research and analysis to help our members understand the conditions in which we are operating.
Read the full Urban IQ Q1 here
Summary of Key Findings
Economic Overview
- Gross Domestic Product
GDP recorded 2.20% annual growth in the year to September 2023, down from 3.09% in the year to June 2023. This signals a broader slowdown since the onset of cash rate increases in May 2022. - Household Savings Ratio
At 1.1%, the savings ratio is at it’s lowest level observed in the last 15 years with households feeling the pinch of inflation and drastically higher loan repayments. - Household Consumption
Household consumption hit its lowest level since Q1. This slowdown in spending is a result of higher mortgage rates and persistent cost of living pressures. - Interest Rates
4.35% Cash Rate (Dec 23)
7.31% Standard Variable Rate for Owner Occupiers (Nov 23)
6.80% 3 Year Fixed Rate (Nov 23)
While the RBA maintained the cash rate at 4.1% in Q3, it issued a 25 basis point increase in November to 4.35%. The rate was held steady in December. Futures markets suggest the cash rate has peaked with declines expected from H2 2024. The RBA remains open to further rate increases if needed. - CPI and the New Dwelling Index
5.4% Australian CPI Q3 year on year.
1.26% CPI Index for new dwellings Q2 2023.
2.16% CPI Index for rents Q2 2023. - Labour Markets
Employment rebounded in October with 34,325 workers added, following a slight decline in September (-1,410 workers). Despite this increase, the unemployment rate rose to 3.8%; up from 3.5% in both September 2023 and the same time last year. - Wages vs. CPI
The hourly rate of pay index rose 1.5% in Q3, marking a 3.69% annual increase. Like last quarter, Q3 saw wages continue to increase at a higher rate than inflation but despite this robust growth, was outpaced by CPI growth resulting in a decline in
real wages. - Market Sentiment
Sentiment has stabilised by remains pessimistic. The current reading of 82 shows improvement from Q2 but has been sub-100 since March 2022. - NAB Business Conditions Index
Business sentiment remains resilient, but the outlook is slightly weaker. While business conditions have seen a slight improvement and remain robust, there is a notable softening in confidence – though it does remain above average. - Victorian Population
The overall population grew by 40,198 through Q2 2023. Although this was the lowest quarterly increase over the last 12 months, it also marks the highest Q2 increase in recent years. The total population increased by 181,846 persons annually; signifying a recent peak in population growth. - Active Estates
New housing developments in greenfield areas have continued to climb, rising by 28 over the twelve-month period to November, to a total of 283 active estates. - Lot Supply
New supply has escalated by 14% over the three months to November 2023, attributed to increased lot releases across Melbourne growth areas. - Lot Sales
Gross lot sales remain on a downward trajectory. However, the rate of decline is slowing, highlighted by the more marginal 2% in sales activity over the three months to November 2023. - Share of Sales by Corridor
Sales activity continues to be heavily concentrated in Melbourne growth areas, although the proportion of lot sales in regional areas is starting to stabilise after diminishing through much of 2023. - Lot Price Change
Based on headline figures, most growth areas have experienced annual lot price growth. Although much of this increase is being eroded by rebates and discounts. - Lot Sizes
Lot sizes are steadying to a level that is both affordable and allows for choice in preferred home size for purchasers. - Melbourne Residential Market
$933,500 = Median House Price.
-5.7% from Q2 2022.
$633,500 = Median Unit Price.
-1.7% from Q2 2022.
$389,000 = Median Lot Price.
+3.4% from Q2 2022.
As a result, prices are still struggling for momentum, although the annual rate of decline is slowing, and the more affordable unit market has recorded a small uptick on recent prices.
Building Activity
- Victoria Building and Finance Activity
Average first home buyer loan size is down -0.6% influenced by diminishing borrowing capacity and a softening of prices in the established housing market – $494,417. - Total Approvals Q3 2023
13,671 approvals, or a 18% increase from Q2 2022. - Approvals and Commencements
13,671 dwellings were approved in Q3, marking an 18% increase from Q2 (11,588 dwellings), yet a –10% decline from the same time last year (15,190 dwellings). Of these, 60% (8,278) were for detached houses, while townhomes (2,677) and apartments (2,716) constituted around 20% of approvals. - Commencements
Total commencements are expected to reach 52,390 dwellings in FY24; a -3.2% decline from last year. FY23 saw a significant -19.5% drop (54,100 dwellings) from FY22 (67,230 dwellings). - Growth Area Affordability
Historically, the common benchmark for identifying housing stress in Australia has been identified as those that allocate at least 30% of disposable household income to finance their mortgage. This ratio has been in place for decades but recently, there is a growing view that the ratio should be closer to 35% to 40% to reflect today’s market. Income ratios in all growth area suburbs have increased, ranging from 38% in Lara and Armstrong Creek to 61% in Burnside.
Outlook
TAILWINDS
- Re-opening of state and international borders
Net overseas migration is a key driver of economic growth. Its return will boost economic activity and alleviate staff shortages across industries. - Improving wage growth and tax cuts
Disposable income to increase as wage growth surpasses inflation, with tax cuts from SH24 further boosting household income. - Compounding demand
Existing built up demand and future demand from record migration will create accelerating housing demand as they look to enter the market. - Forecast interest rate reductions
Major banks currently forecast interest rate reductions to begin in the second half of 2024, which will drive sales activity as consumers have increased borrowing power.
HEADWINDS
- Consumer confidence
Now at a lower level than during the pandemic, with affordability concerns at the centre of focus. - Inflation pressures
Inflation growth to remain above target range of 2% to 3% in FH24, maintaining cost of living pressures for households. - Potential further cash rate rises
Larger correction in established house prices has led to unattractive relative affordability for new homes. - Construction Costs
Although growth in construction costs is slowing, they will remain elevated and not go backwards.

The Urban IQ Property Market reports are produced for UDIA Victoria by RPM Group.
The reports provide a quarterly update on the Victorian residential market including economic activity, prices, finance, building, sentiment and affordability metrics.
