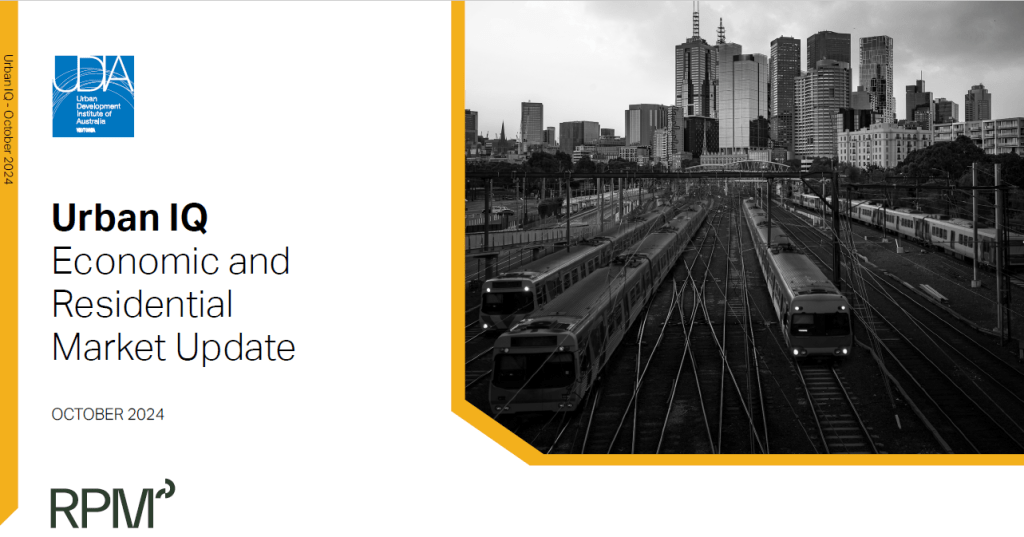
UDIA Victoria, in partnership with RPM Group, has released the latest quarterly URBAN IQ research publication.
The research provides data, research and analysis to help our members understand the conditions in which we are operating.
Summary of Key Findings
Economic Overview
- Gross Domestic Product
GDP increased by only 1.49% over 2024, making one of the smallest gains in over 30 years excluding the pandemic period. - Household Savings & Consumption
The average household savings ratio remained at a low 0.6% in Q2, unchanged from the previous quarter. With this minimal savings buffer, many households are cutting back on discretionary spending, which fell by 1.1%. In contrast, spending on essential goods and services rose by 0.5%. - Interest Rates
4.35% Cash Rate
7.07% Variable Rate
6.27% 3 Year Fixed Rate
Rising inflation at the beginning of the year raised concerns for the RBA who have chosen to keep the cash rate at 4.35% since November 2023. - CPI and the New Dwelling Index
1.02% Quarterly Inflation
3.81% Annual Inflation
0.51% / 1.09% New Dwelling Index
1.84% / 1.97% CPI Rental Index
The CPI rise of 1.02% this quarter, brought the annual increase to 3.81% which is 2-3% above the RBA’s target. - Labour Markets
Employment in Victoria rose by 15,638 in August 2024, with part time jobs rebounding by 7,933 positions after two months of decline and fulltime positions growing for the fourth consecutive month, this time by 7,706 positions. This is the highest unemployment rate in the country, as job creation struggles to keep pace with strong population growth and rising labour market participation. - Unemployment Rate
4.5% August 2024 - Wages vs. Inflation
4.05% Wage Price Index
3.81% Consumer Price Index
The hourly rate of pay rose 0.80% in Q2 2024, below the 1.02% CPI increase, leading to a decline in real incomes. - Consumer Sentiment
85.0 Index August 2024
82.2 Index May 2024
The consumer sentiment index, while still in pessimistic territory at 86 in February, showed improvement – marking its highest reading since June 2022.
Consumer sentiment rose to 85.0 points in August 2024, thanks to stage 3 tax cuts, government cost of living support, and the RBA keeping the cash rate steady. People feel more confident about their finances and the year ahead, with less worry about interest rates. However, homebuyer confidence is still low, as the ‘time to buy’ index dropped due to fears of falling house prices and a weakening job market. - Business Sentiment
+2.8 NAB Business Conditions Index
Business conditions improved slightly in June 2024, although remains below its long-term average.
Businesses are struggling with ongoing supply pressures, especially in material and labour costs, which could push inflation up as prices rise. Whilst retail and construction are weaker due to interest rates, finance, business, and property sectors are seeing increase growth despite challenges. - Victorian Population
+55,333 Total Change Q1 2024
183,959 Total Change Year to March 2024
Victoria’s population surged in Q1 2024, making up a third of the total national increase through strong overseas migration and a spike in births. - +12,302 Natural Increase
- +42,264 Net Overseas Migration
- +767 Net Interstate Migration
- Active Estates
+25 Estates Total Change Year to March 2024
New housing developments in greenfield areas have continued to climb, rising to a total of 317 active estates. - Lot Supply
+1,777 Lots (3 months to August 2024)
-17% Releases of Lot Supply (from previous 3 months)
New supply has increased by 2% over the twelve months to August 2024, due to sustained supply in Northern and Western Regions. - Lot Sales
2,458 Lots (3 months to August 2024)
Gross lot sales over the three months to August 2024 were 8% higher than the previous corresponding period. The Western growth corridor was the only Melbourne growth area to record more lot sales on an annual basis. Conversely, most regional growth areas recorded annual growth in lot sales, with Macedon growth corridor the exception. - Lot Price Change
$389k Median Lot Price
+0.4% Overall Annual Change
Affordability challenges are providing limit scope for growth, with only the Northern growth corridor and Bendigo recording a quarterly increase in their median lot price. - Lot Sizes
365sqm Median Lot Size
South East experienced the greatest decline in median lot size, although it remains notably above corresponding figures in other Melbourne growth corridors of Northern and Western. Affordability reasons also Geelong’s median lot size to diminish. - Clearance Rate
73.2% From 10,617 Auctions
The RBA’s neutral monetary policy stance and the possibility of a rate cut boosted property demand, lifting the median house price by 1.6% in Q1 2024, following eight consecutive quarters of decline. This optimism led to a 32% increase in auctions, with a strong 74% clearance rate, supported by population growth. - Melbourne Residential Market
$911,500 = Median House Price.
-1.5% from last quarter | -2.6% annually
$629,000 = Median Unit Price.
-0.1% from last quarter | +0.2% annually
$387,000 = Median Lot Price.
+0.8% from last quarter | +0.5% annually
Building Activity
- Victoria Building and Finance Activity
$512,974 Average First Home Buyer Loan Size
26,482 Owner Occupier Loans
+23.8% Increase in Owner Occupier Loans From Q1
+0.4% – Non-First Home Buyer Loans (Q4 -23)
$598,140 – Non-First Home Buyer Loans (Q4-23)
26,482 Total New Loan Applications
+21.5% Established Loan Applications
-22.3% Newly Erected Dwelling Applications
+31.8% Construction of a New Dwelling Applications
+42.1% Residential Land
Total Approvals Q2 2024
12,491 Approvals
10.8% Increase from Q1
+8.5% Annual Increase - Commencements
12,182 Total Commencements
-26.1% Over The Quarter
-3.5% Annually - Growth Area Affordability
Historically, the common benchmark for identifying housing stress in Australia has been identified as those that allocate at least 30% of disposable household income to finance their mortgage. This ratio has been in place for decades but recently, there is a growing view that the ratio should be closer to 35% to 40% to reflect today’s market. Income ratios in all growth area suburbs have increased, ranging from 38% in Werribee and Wyndham Vale to 61% in Burnside.
Outlook
HEADWINDS
- Consumer Confidence
Homebuyer confidence remains weak, as the ‘time to buy’ index declined due to concerns over falling house prices and a potentially weakening labour market. - Costs
Businesses are grappling with persistent supply side pressures, particularly in material and labour costs. - Inflationary Pressures
The cash rate remains on hold since November 2023, with businesses likely to pass on higher costs to consumers through increased prices for goods and services. - Population Growth
Strong overseas migration is increasing pressure on the occupier market and underpinning rent inflation.
TAILWINDS
- Consumer Confidence
Wage growth outpaced CPI in Q4, leading to increased purchasing power for households. However, moderating economic growth is resulting in labour market conditions starting to ease. - Melbourne Reputation
Economist Intelligence Unit (EIU) ranks Melbourne the fourth most liveable city in the world, and the most liveable in Australia. Although the EIU cite its decline from third in 2023 is due to housing affordability. - Compounding Demand
Strong population growth and millennial household formation are increasing demand. - Australian Dream
The great Australian dream of home ownership remains. This is achievable through the supply of a diverse dwelling options.

The Urban IQ Property Market reports are produced for UDIA Victoria by RPM Group.
The reports provide a quarterly update on the Victorian residential market including economic activity, prices, finance, building, sentiment and affordability metrics.
